Documentation
Statistical Emulation
Statistical emulation of climate model output involves using a ‘training set’ of simulations for each model to fit the parameters of a simple statistical model that describes the climate response to changing CO2 concentrations. In the tool here, each region is fit separately.
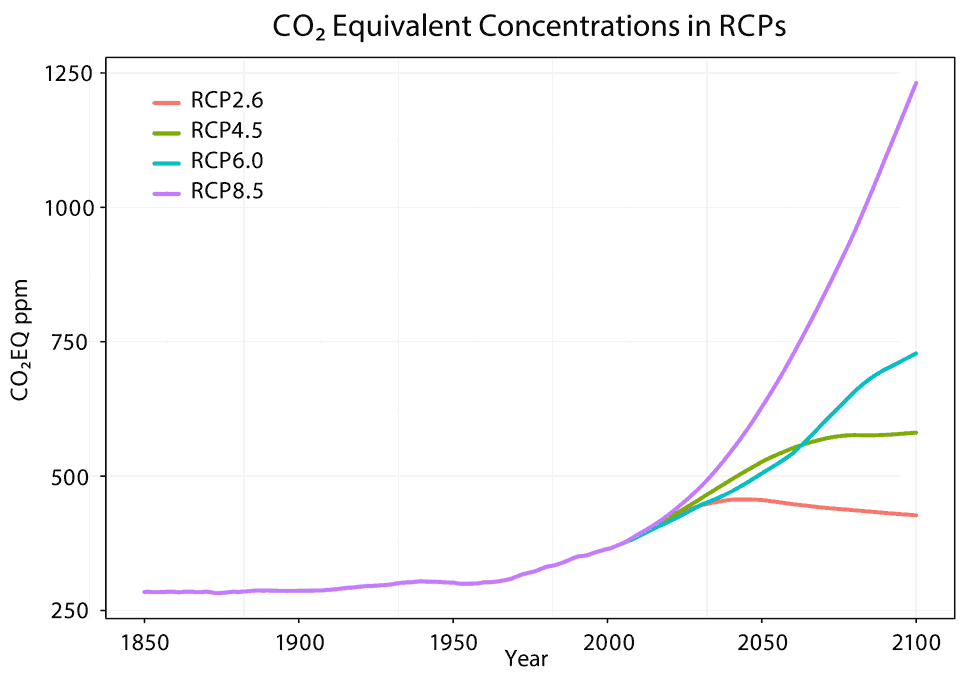
The training set used are archived GCM simulations made as part of the Coupled Model Intercomparison Project 5 (CMIP5), and archived at the Earth Systems Grid database (available from various sites, including here or here). The simulations use CO2 scenarios developed for the Intergovernmental Panel on Climate Change 5th Assessment Report. These ‘Representative Concentration Pathways’, or RCPs, describe the CO2 concentrations associated with various potential emissions scenarios (Figure 1 below). Where available, we use RCP4.5, RCP6.0, and RCP8.5 as the training set. For some models that did not archive all scenarios, we use only RCP4.5 and RCP8.5.
The pre-industrial temeperature for each model is estimated from archived ‘historical’ simulations, as the average over the first 20 years (1850–1869).
The statistical model used for emulation is described in detail in Castruccio et al 2013, with the only difference here being that we simplify the statistical model still further, omitting Castruccio et al’s beta1 term.
All code (in Python) and parameters are publicly available through our Source page, under an LGPL license.
In plots here, to facilitate comparison across models we normalize temperatures for each model and region to the multi-model mean for the period 1994–2004. For global temperature, we normalize to the NASA-GISS observed 1951–1980 global mean temperature of 14.0 C (57.2 F).
Models and regions
We are currently emulating 14 models and are in progress on extending emulation to all CMIP5 models with sufficient archived data.
The current version of the emulation tool can emulate BCC-CSM-1.1, CanESM2, CCSM4, CNRM-CM5, GISS-E2-R, GISS-E2-H, HadGEM2, IPSL-CM5A-MR, MIROC5, MIROC-ESM-CHEM, MPI-ESM-LR, MPI-ESM-MR, MRI-CGCM3, and NorESM.
Of these models, four do not include RCP6.0 (CanESM, CNRM-CM5, MPI-ESM-LR, and MPI-ESM-MR).
We are extending the tool to include over 9 additional models: ACCESS-1.0, ACCESS-1.3, BNU-ESM, CESM1, CSIRO-Mk3.6.0, EC-EARTH, FGOALS, FIO-ESM, and various versions of the GFDL model.
Emulation is performed on regions at larger than native model resolution. For land areas, regions are chosen to follow national borders. Individual regions either lie within a single large country or contain groups of smaller countries. For a mapping of regions to countries, see this table.
Running a user-specified CO2 scenario
We have included several scenarios as examples, including three for which GCM runs have already been completed and archived. However, the real purpose of an emulator is to generate projections for scenarios that have not yet been simulated by the larger models. Users can generate projections for arbitrary scenarios by uploading a text file of CO2 concentrations.
The file format is a comma-separated list of annual mean CO2 concentrations, in parts per million (ppm), for each year, beginning with the year 2005. (For reference, pre-industrial CO2 was believed to be about 270 ppm, and current CO2 concentration is about 400 ppm.) The list can be either a row or a column. In most browsers, the file can be uploaded simply by dragging over the upload box on the webpage. Users with older browsers may have to use the ‘choose file’ button.
Once the file is uploaded, the emulation tool will produce plots that show emulated model responses to the user-specified CO2 scenario.
Future developments
Planned improvements to the emulator tool include
- Making emulation output available as text files
- Adding more models (as described above)
- Plotting GCM output along with emulations, for those scenarios where GCM output is available
- Allowing user-controlled y-axis ranges to facilitate comparisons
- Adding maps of temperature changes at any given time
- Adding emulation of short-term climate variability
We welcome feedback, and suggestions. Please send comments to info-rdcep@ci.uchicago.edu
Developers
The emulation team includes: Alison Brizius, Stefano Castruccio, Robert Jacob, William Leeds, Feifei Liu, Nathan Matteson, John Moosemiller, David McInerney, Liz Moyer, Andrew Poppick, Aidan Sakowski, Michael Stein, and Grant Wilder
For media inquiries, please contact Rob Mitchum. (773) 484 9890. rmitchum@uchicago.edu.